Gantt Chart: Manage Your Projects With Transparency and Efficiency
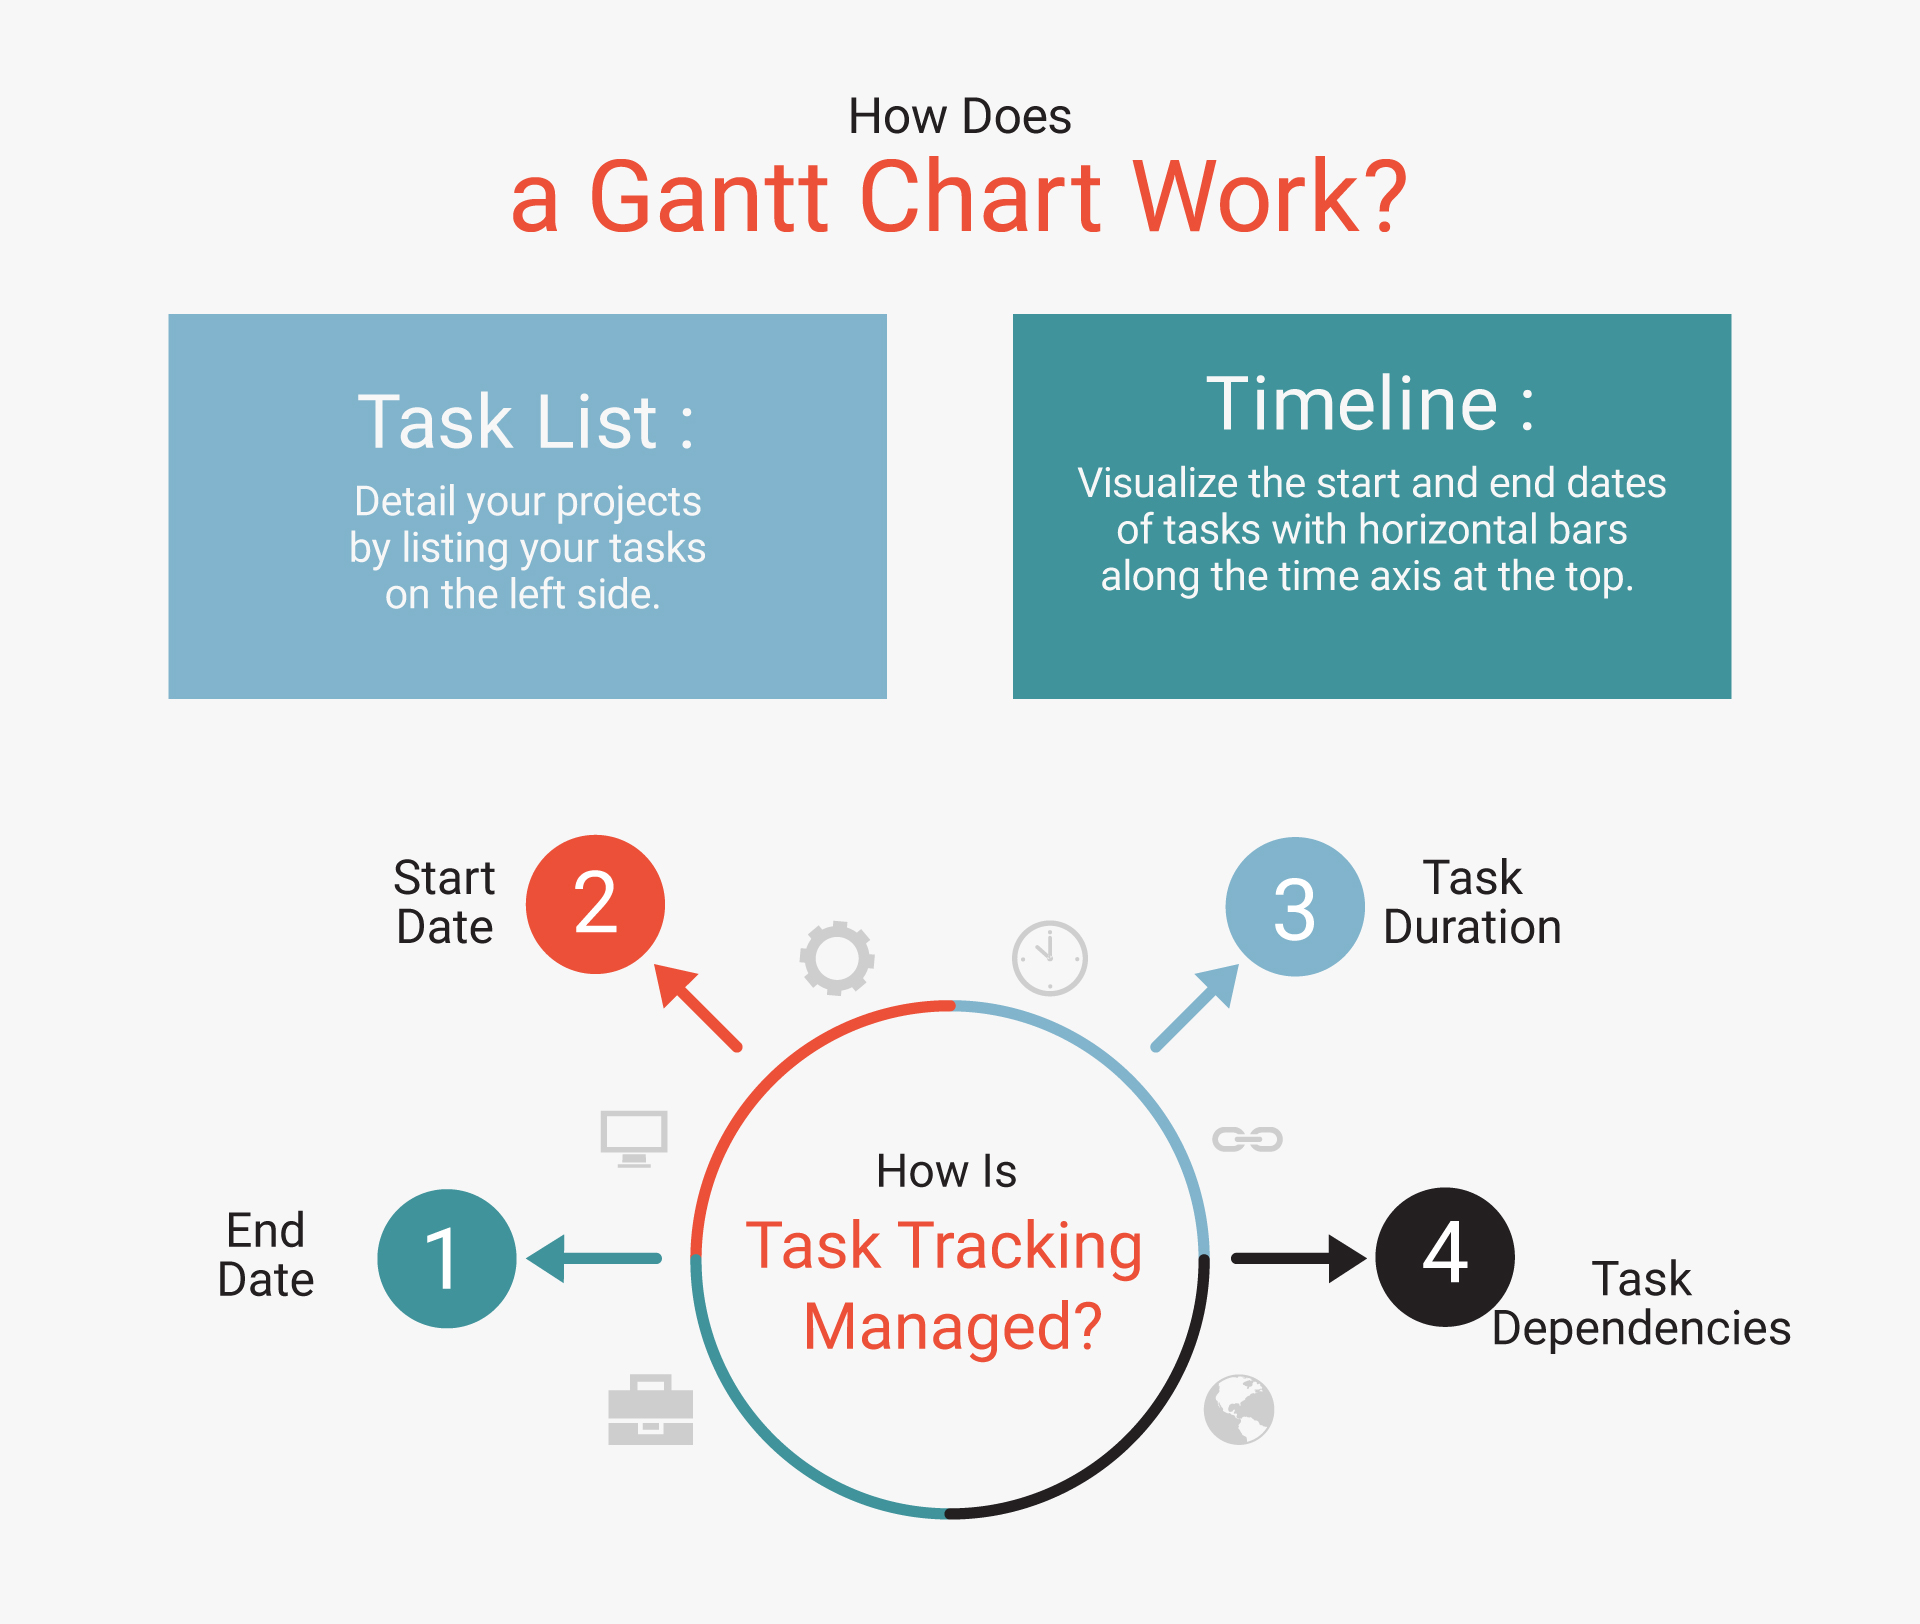
What is a Gantt Chart?
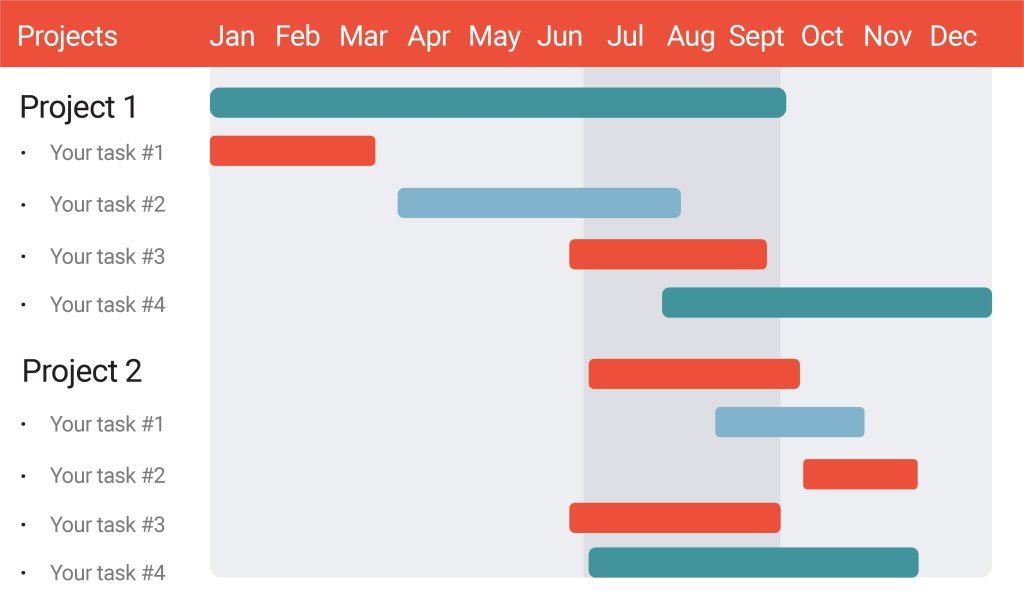
A Gantt chart allows you to visualize your project timelines, clarify task relationships, and manage your processes more efficiently. Originally developed by Henry Gantt, this method has become an indispensable part of modern project management.
Gantt charts graphically display tasks’ start and end dates, durations, and dependencies along a time axis. With Netoloji’s user-friendly interface and drag-and-drop technology, you can plan your projects quickly and easily.
What Can You Achieve with a Gantt
Project Planning
Define, prioritize, and place your tasks on the timeline.
Progress Tracking
Easily see the current status of your projects.
Resource Management
Optimize your team members’ tasks and time usage.
Communication and Collaboration
Ensure all team members are on the same page and strengthen collaboration.
Advantages of Using E-Flow Gantt Chart
Visual Clarity
View all tasks and schedules on a single screen.
Progress Tracking
Easily monitor task statuses and overall project progress.
Resource Management
Identify where resources are being used to create a more efficient process.
Flexibility
Customize the Gantt chart as you wish and adapt to changing needs.
Communication
The chart ensures clear communication among team members and stakeholders.
Achieve Success with E-Flow Gantt Chart!
The path to success in project management starts with using the right tools. With E-Flow Gantt Chart, you can manage your projects transparently, organized, and effectively.